 |
GeneFISH – combined detection of genes and rRNA in microorganisms
B1. Gene probes
When you are using this protocol, please cite:
Moraru, C., Lam, P., Fuchs, B.M., Kuypers, M.M.M. and Amann, R. (2010) GeneFISH – an in situ technique for linking gene presence and cell identity in environmental microorganisms. Environ. Microbiol. 12: 3057-3073.
Introduction to geneFISH
A. Sample preparation
A1. Sample fixation
A2. Sample immobilization
A3. Embeding in agaroze
A4. Permeabilization
A5. Inactivation of endogeous peroxidases
B. gene detection
B1. gene probes
B1.1. probe design
B1.2 probe synthesis
B1.3 determination of hybridization conditions for hybridization and washing
B2. gene hybridization
B3. antibody binding
B4. gene CARD and inactivation of HRPs from the gene detection step
C. rRNA detection
C1. rRNA hybridization
C2. rRNA CARD
D. Mounting for microscopy and counterstaining
E. Microscopy
F. List of materials
B1. Gene probes
B1.1 Probe design
The probes used for gene detection are double stranded DNA (dsDNA) polynucleotides which carry Digoxigenin (Dig) as label. Their length can vary between 100-450 bp, even higher, with a preferred size of 300-350 bps. The shorter the probes, the easier they permeate the cells. On the other hand, shorter probes will have a lower number of labels, resulting in decreased signal intensity, which can lead to decreased detection efficiency.
Due to their length, the well established concept for oligonucleotide probe design cannot be transferred to polynucleotides. Oligonucleotide probes are designed to match the targeted region perfectly. On the other hand, polynucleotide probes are actually used because they still work with some mismatches in their targets. The percentage mismatch (%MM) and the hybridization conditions will determine if a polynucleotide probe binds to a target or not, by influencing the stability of the probe/target hybrids and the hybridization rate. Hybrid stability is dependent on the length, GC content (%GC), %MM and certain chemicals. It can be measured by determining the melting temperature (Tm).
“Functional” genes in microorganisms are characterized by high sequence diversity, and, as result, in environmental samples, there are many alleles of the same gene. Depending on the sequence distance between the alleles, one or more polynucleotide probes can be needed to cover the whole diversity of the target gene. A concept and software for design of polynucleotide probes is described in (Moraru et al., 2011).
B1.2 Probe synthesis
The probes are synthesized by PCR, during which Dig-dUTPs are incorporated into the DNA molecule (see Figure 2). The kit used is the PCR Dig Probe Synthesis Kit, from Roche. A very important step following the probe synthesis is the probe purification with removal of labeled NTPs. Improper purification could lead to increased background during FISH procedures. The probes can be purified using the Gene Clean Turbo kit. After purification, the size and integrity of the probes can be checked by gel electrophoresis. Incorporation of Dig reduces the electrophoretic mobility of nucleic acids (Holtke and Kessler, 1990), so that they migrate slower than their unlabeled counterparts (see Figure 3). This could be used as a confirmation for Dig incorporation.
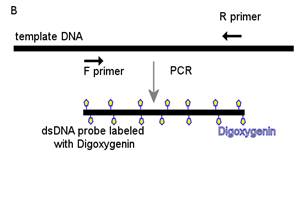
Figure 2 : gene probe synthesis
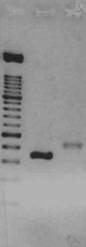
Figure 3 : Difference in electrophoretic mobility between Dig labeled and unlabeled dsDNA. Lane 2 – dsDNA without Dig. Lane 3 – the same dsDNA with Dig. Lane 1 – 100 bp DNA ladder.
B1.3 Determination of the stringency conditions for hybridization and washing
The stringency parameters for hybridization include the composition of hybridization and washing buffers (Na+ and formamide concentration), as well as hybridization and washing temperatures. The ideal parameters should allow for: (i) specific hybridization, (ii) optimum hybridization rate, and (iii) preservation of cellular morphology (low temperatures).
Determination of the stringency parameters requires the knowledge of the melting temperature (Tm) of the hybrid formed between probe and target. Two methods can be used to determine Tm: theoretical calculations and in vitro measurements. For the former, formulae were implemented in PolyPro software to calculate the Tm (Moraru et al., 2011). For in vitro measurements, a modified protocol for Tm determination with dsDNA binding dyes and real-time fluorescence detection (Monis et al., 2005; Gudnason et al., 2007) can be used.
In this in vitro method, the fluorescence conferred by the intercalating dye Syto9 is high when the DNA is double-stranded, while fluorescence levels drop when the DNA melts and becomes single-stranded. The Tm appears as a distinct peak when the negative of the first derivative of fluorescence is plotted versus temperature (see Figure 4). We modified the original protocol to measure the Tm in hybridization-like and washing-like buffers. These buffers have the exact composition of the hybridization and washing buffers used for gene detection, except that they do not contain the blocking reagents.
The initial tests showed that Syto9 can be used for measuring Tm in buffers containing formamide, SDS and high salt concentrations. The next step was to develop a strategy to measure the Tm of the hybrid formed between the probe and the target. Because the probe is Dig-labeled, while the target is not, the probe-target hybrid would have a strand with Dig and the other without. To measure the Tm of such a hybrid, the thermal protocol was modified to consist of denaturation, hybridization and subsequent melting. The first two steps are necessary to promote the formation of hybrid molecules. The probe, target and probe-target hybrid are measured in individual reactions.
In Figure 4 there is an example of such measurements. As expected, the probe, target and probe-target hybrid have a different Tm, with that of the probe being the lowest and of the target the highest. The Tm of the hybrid is intermediary between the ones for probe and target, and its peak can be recognized by comparison with the peaks from only target or only probe reactions. This strategy for hybrid formation works only in hybridization-like buffers. In the case of washing-like buffers, no hybrid peak can be detected, due to the low Na+ concentration, unfavorable for hybridization.
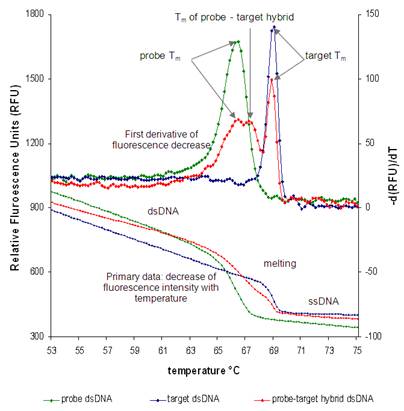
Figure 4 : In vitro measurements of the melting temperature (Tm) for the amoA-1E3 probe (green) (both strands with Dig), target (blue) (neither of the strands with Dig) and hybrid (red) (one strand with Dig and one without). The measurements were performed in hybridization-like buffer, with 35% formamide and 1.718 M Na+. The primary data represented the fluorescence (expressed as relative fluorescence units-RFU) decrease with increasing temperature. The first derivative showed the Tm as a peak. In the hybrid reaction, three Tm peaks appeared: one peak for the probe duplex, one peak for the hybrid duplex and one peak for the target. To identify the peaks, comparison with the individual reactions for probe and target was necessary.
Protocol for Tm measurements in hybridization-like buffer
For measurements in hybridization-like buffers, prepare first the buffers as described below. Then, add 3 µl of 5 mM Syto9 to 1.5 ml of hybridization-like buffer, to get a final concentration of 10 µM Syto9. To 100 µl of the latter mixture add 6 µl of dsDNA (230-350 ng), and aliquot the resulting solution in 25 µl per well. The thermal protocol used for the Tm determination in hybridization-like buffer is the following: denaturation at 80°C (up to 95°C) for 5 min, hybridization at 42°C for 25 min and melting from 50°C to 75°C, +0.2°C per 1.5 min, minimum ramp rate.
Protocol for Tm measurements in washing-like buffer
The composition of the washing-like buffer II is 0.1x SSC, 0.1% SDS, 10 µM Syto9 dye and dsDNA (~240 ng per 25 µl reaction). The thermal protocol used for Tm in washing-like buffer is: from 50°C to 75°C, +0.2°C per 1.5 min, minimum ramp rate.
Preparation of 20 ml of 35% formamide hybridization-like buffer (for geneFISH)
In a 50 ml Falcon tube, add the following:
Component |
Volume |
Final concentration |
Na+ contribution (mM) |
20x SSC |
5 ml |
5x |
975 |
Dextran sulfate |
2 g |
10% |
660 |
0.5 M EDTA |
0.8 ml |
20 mM |
80 |
water |
5.2 ml |
|
|
Shake to dissolve dextran sulfate and incubate at 48°C (water bath) until dextran sulfate is dissolved
Cool to room temperature
Add the following components:
Component |
Volume |
Final concentration |
Na+ contribution (mM) |
100% formamide |
7 ml |
35% |
|
20% SDS |
100 µl |
0.1% |
3.45 |
| |
|
|
Total Na+ = 1718 mM |
Vortex, spin down
Aliquot and store at -20°C
* the contribution of dextran sulfate to the Na+ concentration was calculated from the molecular formula of dextran sulfate 500 000, assuming 3 Na+ per glucosyl residue.
References:
Gudnason, H., Dufva, M., Bang, D.D., and Wolff, A. (2007) Comparison of multiple DNA dyes for real-time PCR: effects of dye concentration and sequence composition on DNA amplification and melting temperature. Nucleic Acids Res 35: e127.
Monis, P.T., Giglio, S., and Saint, C.P. (2005) Comparison of SYT09 and SYBR Green I for real-time polymerase chain reaction and investigation of the effect of dye concentration on amplification and DNA melting curve analysis. Anal Biochem 340: 24-34.
Moraru, C., Moraru, G., Fuchs, B.M., and Amann, R. (2011) Concepts and software for a rational design of polynucleotide probes. Environmental Microbiology Reports 3: 69-78.
Moraru, C., Lam, P., Fuchs, B.M., Kuypers, M.M.M., and Amann, R. (2010) GeneFISH – an in situ technique for linking gene presence and cell identity in environmental microorganisms. Environ Microbiol 12: 3057-3073.
|
|


